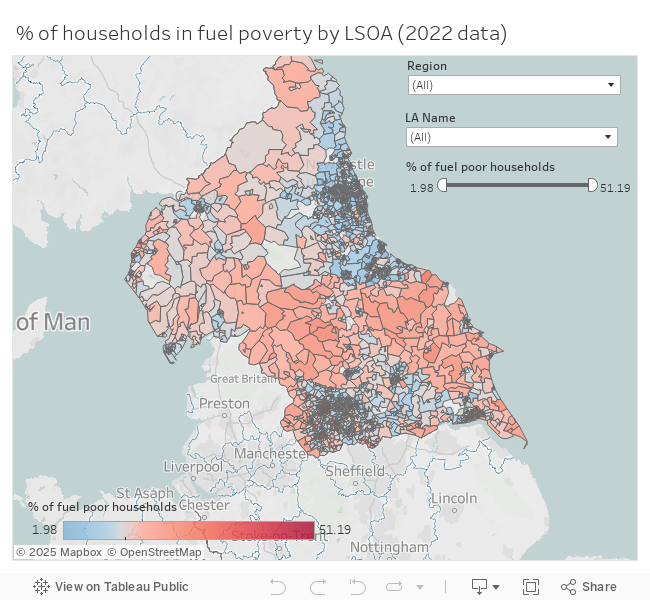
The government published fuel poverty statistics for Lower Super Output Areas (LOSAs) in December 2024 (these relate to 2022 data). LSOAs are the smallest geographical areas for which statistics are available, with each covering 400-1200 households. We have created an interactive map of these statistics, enabling you to explore figures in your own area.
NB. The map represents the area covered by Northern Gas Networks which corresponds with some of our funded projects.
What can you do?
You can select your own local authority area using the drop-down menu and then zoom in further to explore the figures.
You can use the scroll bar ‘% fuel poor households’ to see the LSOAs that have the highest levels of fuel poverty.
You can download the figures for whichever area(s) you have selected using the box with the downwards arrow underneath the map.
How does your area compare?
- England – 13.1%
- Yorkshire & Humber – 17%
- Northeast – 10.9%
- North West – 14.1%
NB. The government in England uses the ‘Low Income Low Energy Efficiency method for defining fuel poverty. Scotland, Wales and National Energy Action use an alternative definition which views households in fuel poverty if they need to spend 10% or more of their income to heating the home to a satisfactory level (fuel poverty rates are typically higher under this second definition).